90 Minute Sleep Cycle Chart — Complete Visual Guide to Sleep Stages
A 90 minute sleep cycle chart is one of the most useful tools for understanding why you feel refreshed on some mornings and completely exhausted on others. Your brain does not simply “sleep” — it cycles through four distinct stages every 90 minutes all night long. Visualizing this 90-minute sleep cycle chart helps you understand exactly what your brain is doing while you sleep, and more importantly, gives you the knowledge to time your wake-up perfectly so you always rise at the easiest, lightest point of the cycle.
🌙 Use the science: The WakeCalc Sleep Cycle Calculator uses this exact 90-minute sleep cycle chart science to calculate your perfect bedtime — free and instant.
What Is the 90-Minute Sleep Cycle Chart?
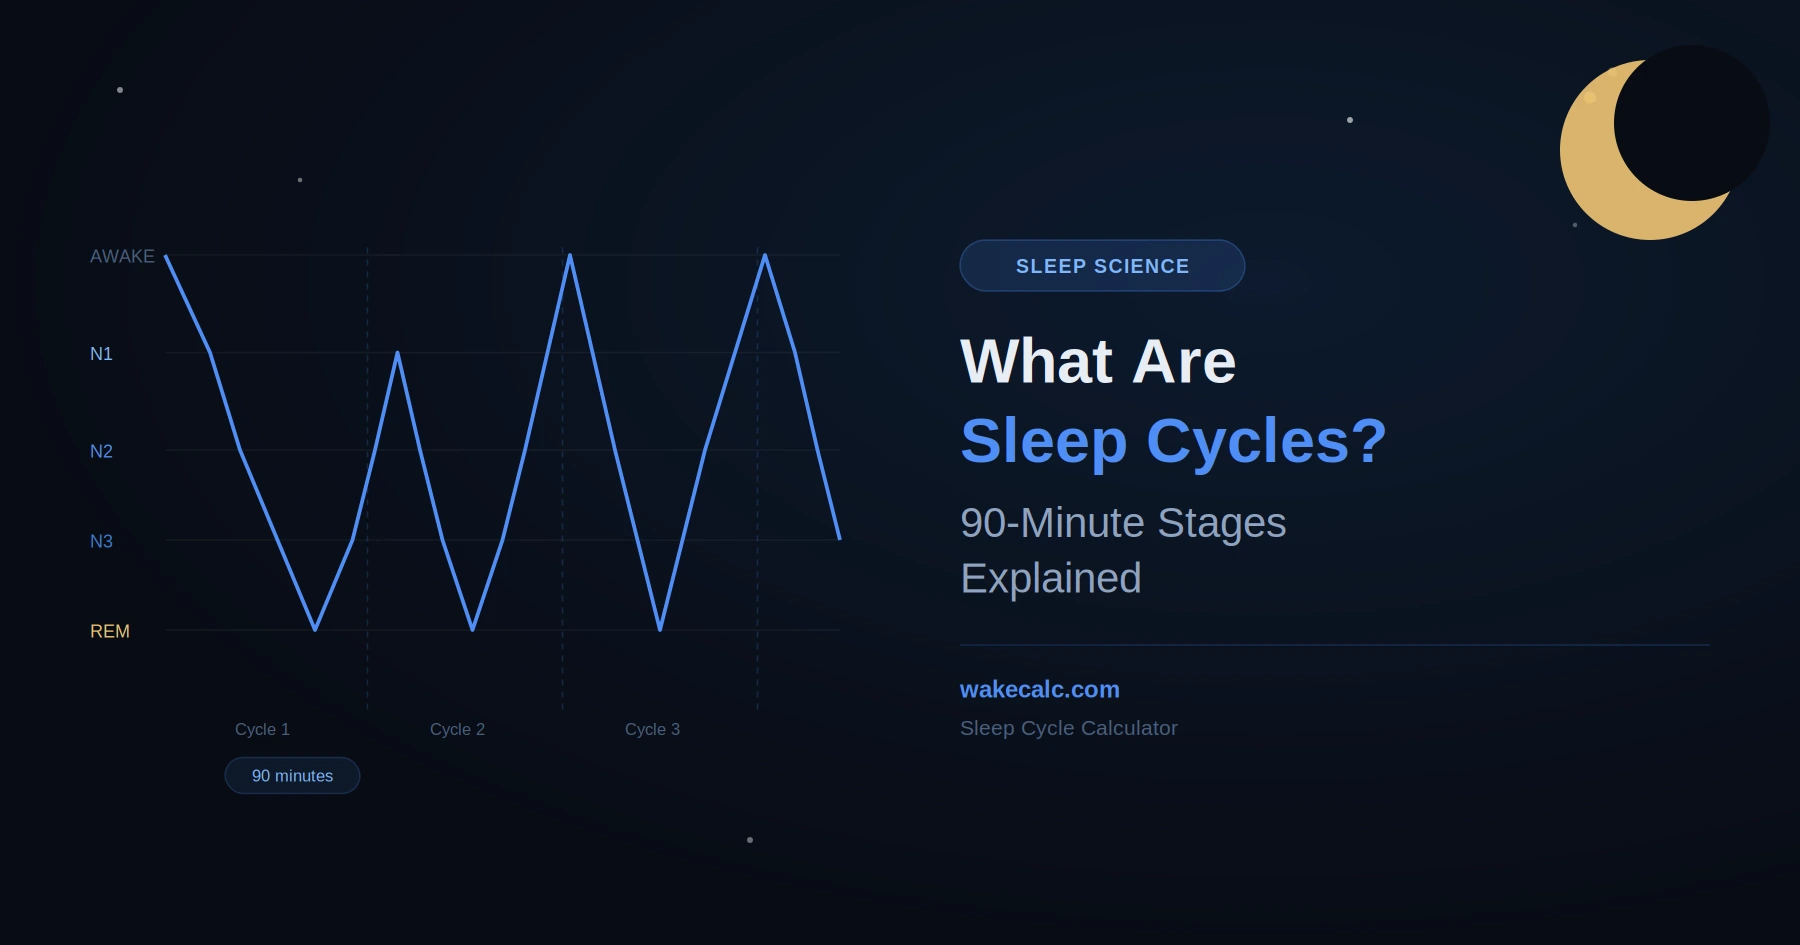
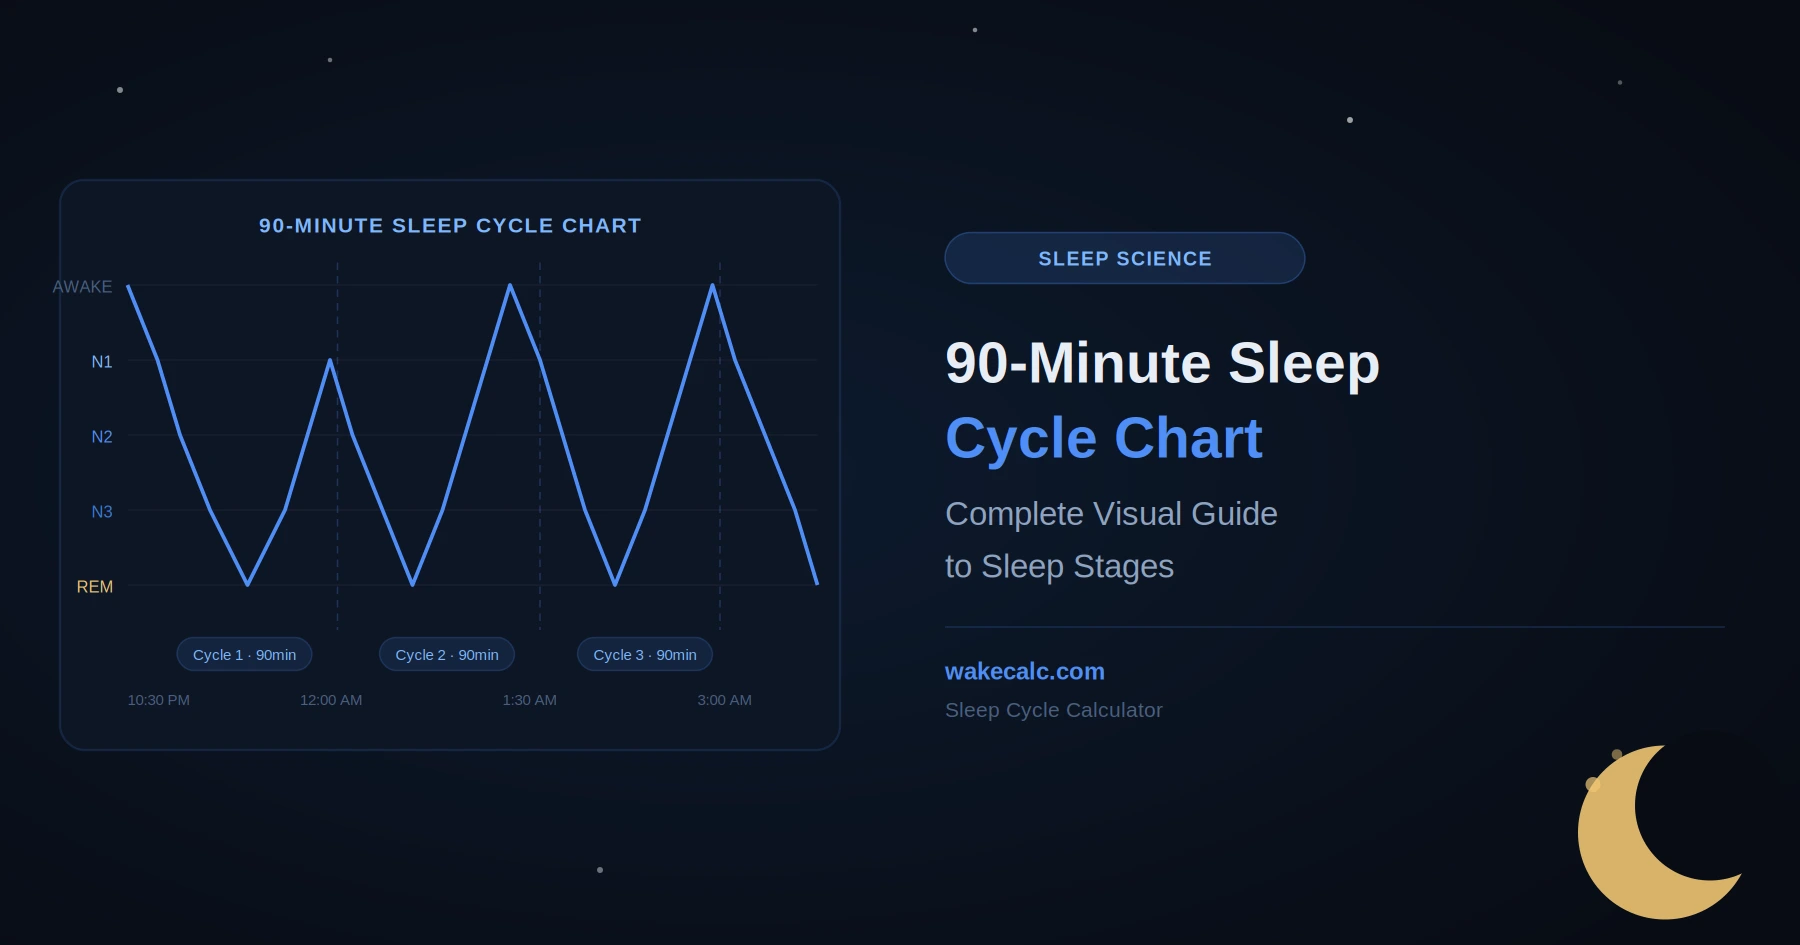
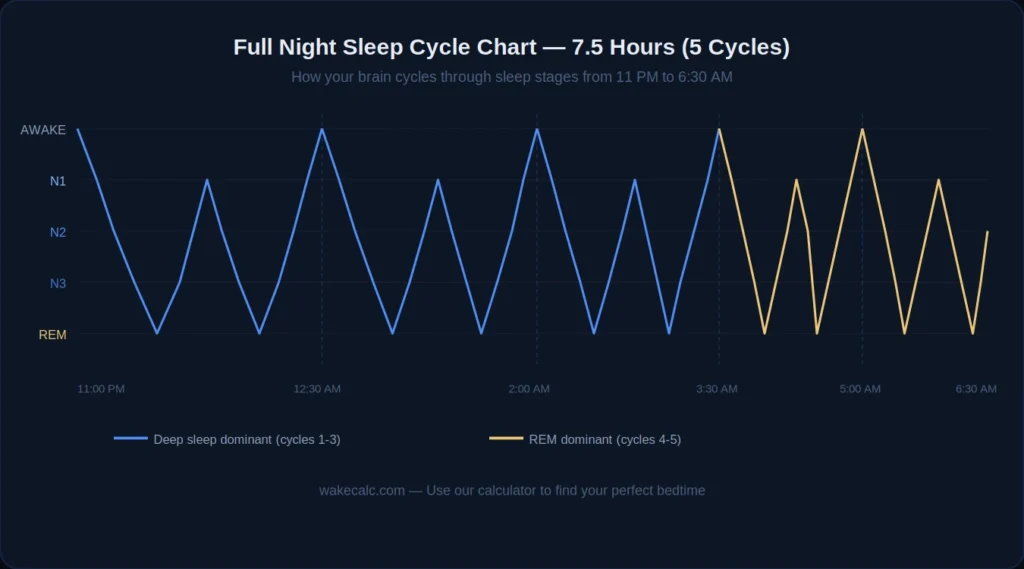
The 90 minute sleep cycle chart — also called a sleep hypnogram — is a visual representation of how your brain moves through different sleep stages throughout the night. Each complete loop through all four stages takes approximately 90 minutes, which is why sleep scientists call it the 90-minute sleep cycle.
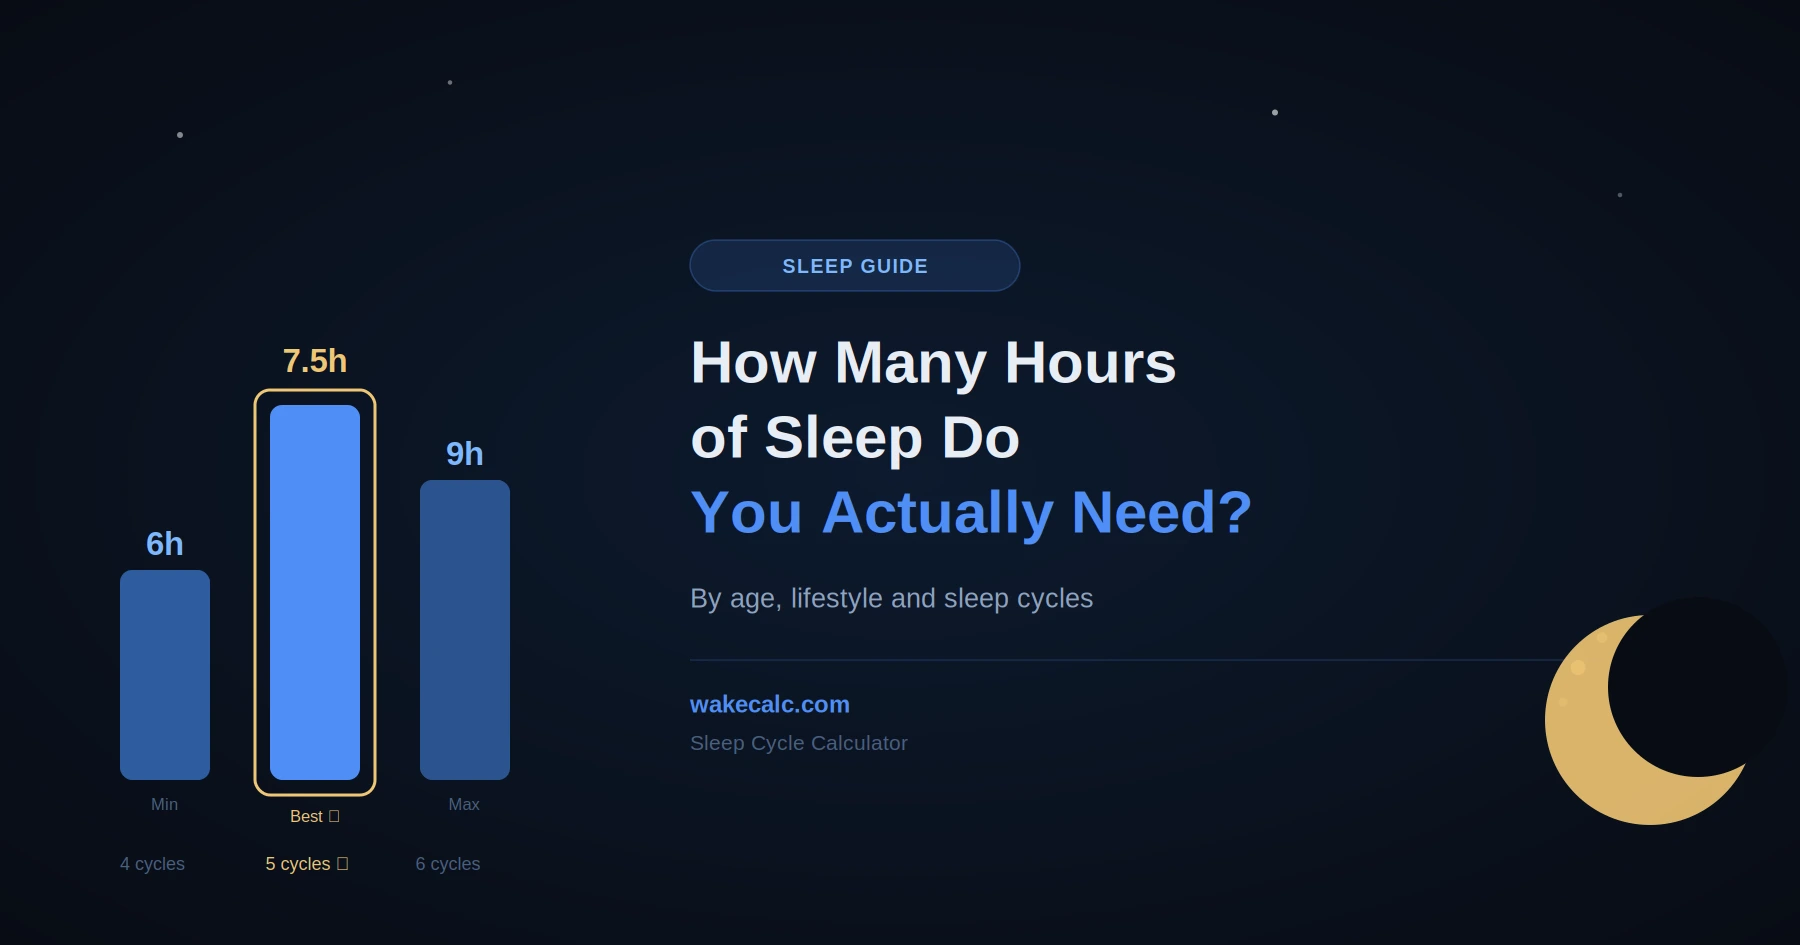
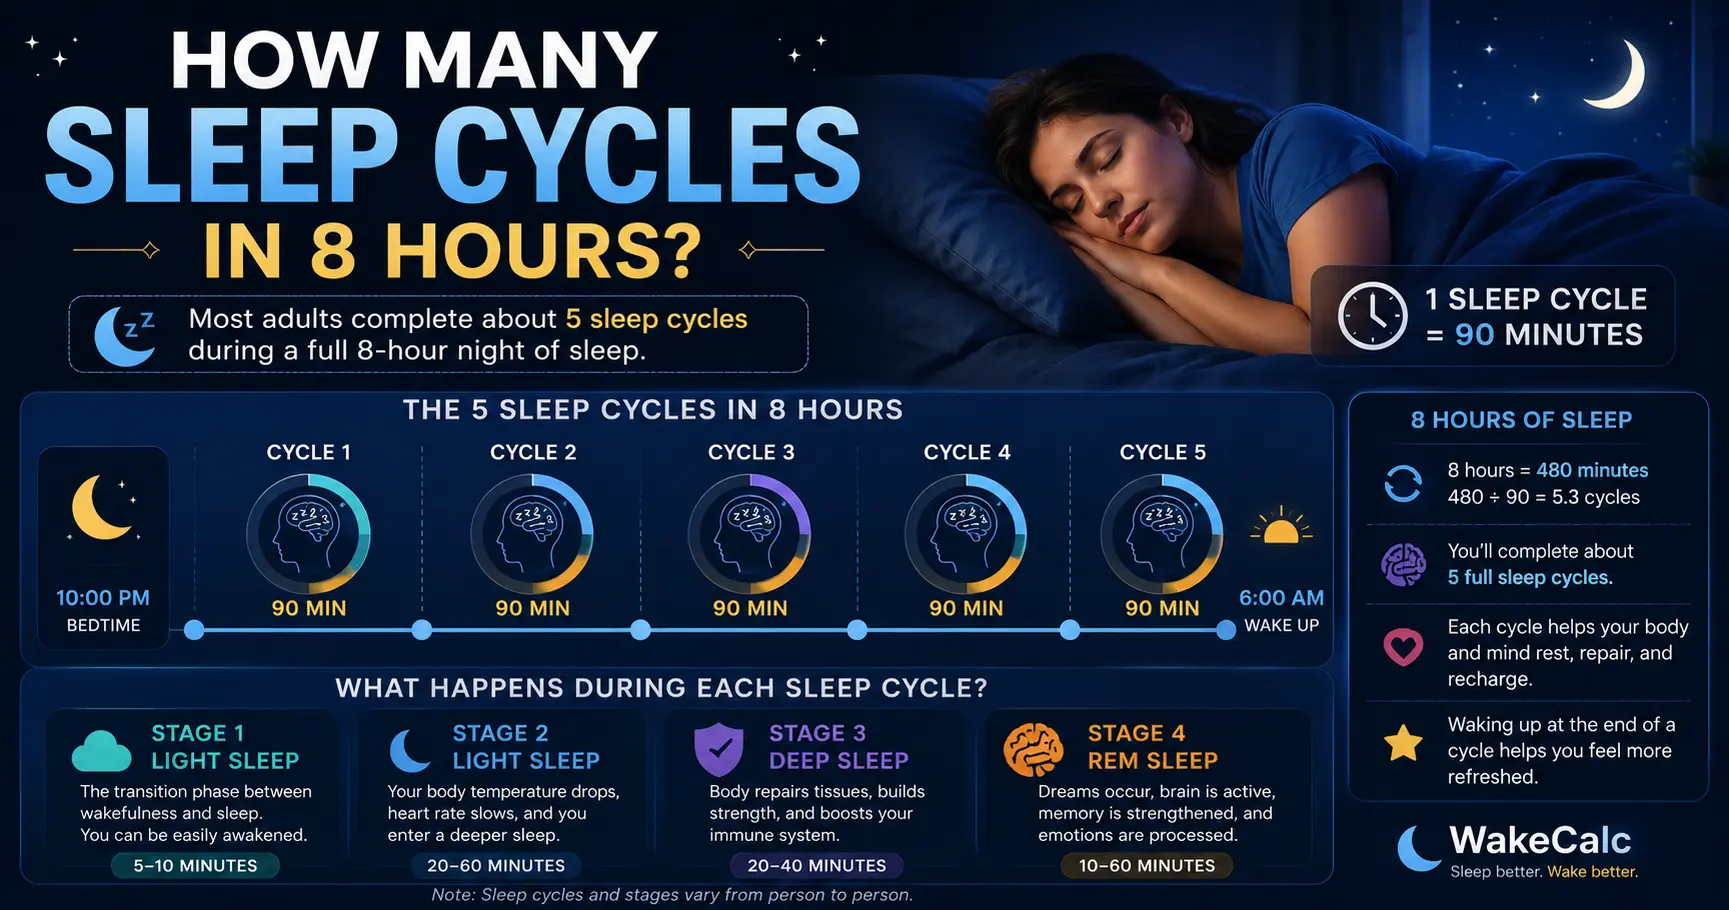
According to research published on the National Institutes of Health, the body cycles through all sleep stages approximately 4 to 6 times each night, averaging 90 minutes for each cycle. A typical adult completes 5 full cycles per night — totaling 7.5 hours of sleep.
Reading a 90 minute sleep cycle chart from left to right shows your brain descending from wakefulness down through increasingly deeper sleep stages, reaching the deepest point, then climbing back up through lighter stages before entering REM (dream) sleep — and then the entire loop starts again.
The 4 Stages of the 90-Minute Sleep Cycle Chart Explained
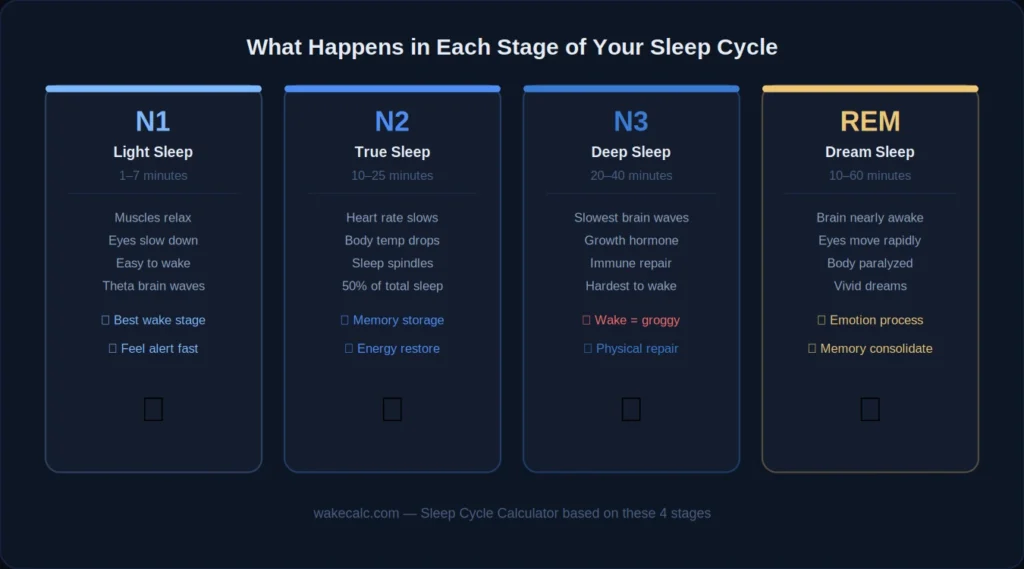
Every single loop in the 90-minute sleep cycle chart contains four stages. Here is exactly what happens in each one:
Stage N1 — Light Sleep (1–7 Minutes)
N1 is the entry point of every 90 minute sleep cycle. Your muscles relax, eye movements slow, and brain waves shift from the active beta waves of wakefulness to slower theta waves. This stage is very brief and easy to wake from. If your alarm happens to catch you in N1 at the very end of a cycle — you will feel alert almost immediately. This is exactly why timing your wake-up to the end of a 90-minute cycle is so powerful.
Stage N2 — True Sleep (10–25 Minutes)
N2 is the most abundant stage in the 90 minute sleep cycle chart — you spend roughly 50% of your total sleep time here across all cycles. Your core body temperature drops, heart rate slows, and the brain produces characteristic bursts of activity called sleep spindles that are associated with memory consolidation. N2 sleep gets progressively longer in later cycles as the night continues.
Stage N3 — Deep Sleep (20–40 Minutes)
N3 is the deepest and most physically restorative stage in the 90 minute sleep cycle chart. The brain produces slow delta waves, your immune system is most active, growth hormone is released for cellular repair, and blood pressure drops to its lowest point of the day. This is the hardest stage to wake from. If your alarm interrupts N3 deep sleep, you will experience severe sleep inertia — the intense grogginess that can last for hours regardless of how long you slept.
A critical pattern visible in the full-night 90-minute sleep cycle chart: N3 deep sleep is most abundant in the first two cycles of the night and decreases significantly with each successive cycle. This means the early cycles are when your body prioritizes physical repair.
Stage REM — Dream Sleep (10–60 Minutes)
REM sleep is the final and most cognitively important stage of each 90-minute cycle. Your brain becomes nearly as active as when you are fully awake, your eyes move rapidly beneath your eyelids, and your body is temporarily paralyzed to prevent you from acting out dreams. This is when emotional processing, creativity, and long-term memory consolidation happen most intensely.
The opposite of N3, REM sleep increases dramatically toward the end of the night. Your final sleep cycle before waking can be almost entirely REM sleep — which is why cutting sleep short by even one cycle disproportionately destroys your cognitive function, mood, and creativity for the day.
How the 90-Minute Sleep Cycle Chart Changes Through the Night
One of the most important things to understand from the 90 minute sleep cycle chart is that not all cycles are equal. According to the Sleep Foundation, the composition of each cycle shifts as the night progresses:
- Cycles 1–2 (Hours 1–3): Dominated by N3 deep sleep. This is when your body prioritizes physical repair, immune function, and growth hormone release. Very little REM sleep occurs here.
- Cycles 3–4 (Hours 3–6): Deep sleep decreases significantly. N2 and REM sleep increase. Both physical and cognitive recovery are happening simultaneously.
- Cycle 5 (Hours 6–7.5): Almost no deep sleep at all. The final cycle is predominantly REM sleep — the most cognitively valuable stage. This is when your brain processes emotions, consolidates memories, and prepares you for the day ahead.
This is precisely why the 90 minute sleep cycle chart shows that sleeping 7.5 hours (5 complete cycles) provides a fundamentally different quality of sleep than sleeping 6 hours (4 cycles). The 5th cycle gives you that final, critical REM-rich period that 4-cycle sleep completely misses.
How to Read Your Own Sleep Cycle Chart
Modern sleep trackers like Oura Ring, Fitbit, and Apple Watch all generate a personalized version of the 90 minute sleep cycle chart for your individual sleep. When reading yours, look for:
- 🔵 Deep N3 blocks concentrated early — this is healthy and normal
- 🟡 REM blocks growing longer toward morning — another healthy sign
- ⚠️ Fragmented cycles with many interruptions — indicates disrupted sleep quality
- ⚠️ Very little N3 throughout the night — could indicate sleep deprivation or sleep disorder
- ⚠️ Waking during deep N3 — explains morning grogginess regardless of total duration
Using the 90 Minute Sleep Cycle Chart to Optimize Your Wake Time
The most practical application of the 90 minute sleep cycle chart is to time your alarm to the natural endpoint of a cycle — the transition between cycles when you are briefly in very light N1 sleep. Waking here requires almost no effort and produces zero sleep inertia.
The calculation is simple:
- Decide your target wake time (e.g., 7:00 AM)
- Add 15 minutes for falling asleep
- Count backwards in 90-minute cycle blocks: 5:45 → 4:15 → 2:45 → 1:15 → 11:45 PM → 10:15 PM
- Set your bedtime to 10:15 PM for 5 complete cycles (7.5 hours)
Or simply use the WakeCalc Sleep Cycle Calculator — enter your wake time and get all your ideal bedtimes instantly, based on exactly this 90 minute sleep cycle chart science.
Frequently Asked Questions About the 90 Minute Sleep Cycle Chart
Is the 90 minute sleep cycle chart the same for everyone?
The 90 minute sleep cycle chart shows the average adult pattern. Individual cycles can range from 80–110 minutes. Children have shorter cycles (around 50 minutes). Older adults spend less time in deep N3 sleep as they age. Alcohol, medications, and stress all alter the shape of your personal sleep cycle chart significantly.
What does an unhealthy sleep cycle chart look like?
An unhealthy 90-minute sleep cycle chart typically shows very little deep N3 sleep, fragmented cycles with many brief awakenings, disproportionately low REM sleep, or very long periods stuck in N2 without progressing deeper. Sleep apnea creates a distinctive fragmented chart with constant interruptions throughout the night.
How many 90-minute sleep cycles do I need?
Most adults need 5 complete 90-minute sleep cycles per night — totaling 7.5 hours. Athletes and teenagers often need 6 cycles (9 hours). Use the WakeCalc calculator to find the exact bedtime for your required number of cycles.
Can I change how my sleep cycle chart looks?
Yes — consistently. Getting more deep N3 sleep requires: keeping your bedroom cool (65–68°F), avoiding alcohol, exercising regularly (but not too close to bedtime), and maintaining a consistent sleep schedule. Getting more REM sleep requires simply completing more total cycles — which means going to bed earlier or waking up later.
Why does the 90-minute sleep cycle chart show more REM toward morning?
This is a biological feature, not a bug. Your body prioritizes physical repair (N3 deep sleep) in the first half of the night when sleep pressure is highest. As physical recovery completes, the brain shifts resources toward cognitive processing and emotional regulation (REM sleep) in the second half. Cutting sleep short in the morning removes this critical REM-rich period entirely.
The 90 minute sleep cycle chart reveals one of the most important truths about human sleep: what time you wake up matters as much as how long you sleep. By understanding the four stages of each 90-minute cycle and timing your alarm to natural cycle endpoints, you can transform your mornings completely. Use the WakeCalc Sleep Cycle Calculator to put this 90-minute sleep cycle chart science to work for you tonight. 🌙
Calculate Your Perfect Sleep Cycle Timing
Enter your wake-up time and WakeCalc shows the perfect bedtimes for 4, 5, or 6 complete 90-minute sleep cycles — free and instant.
Try WakeCalc Free →